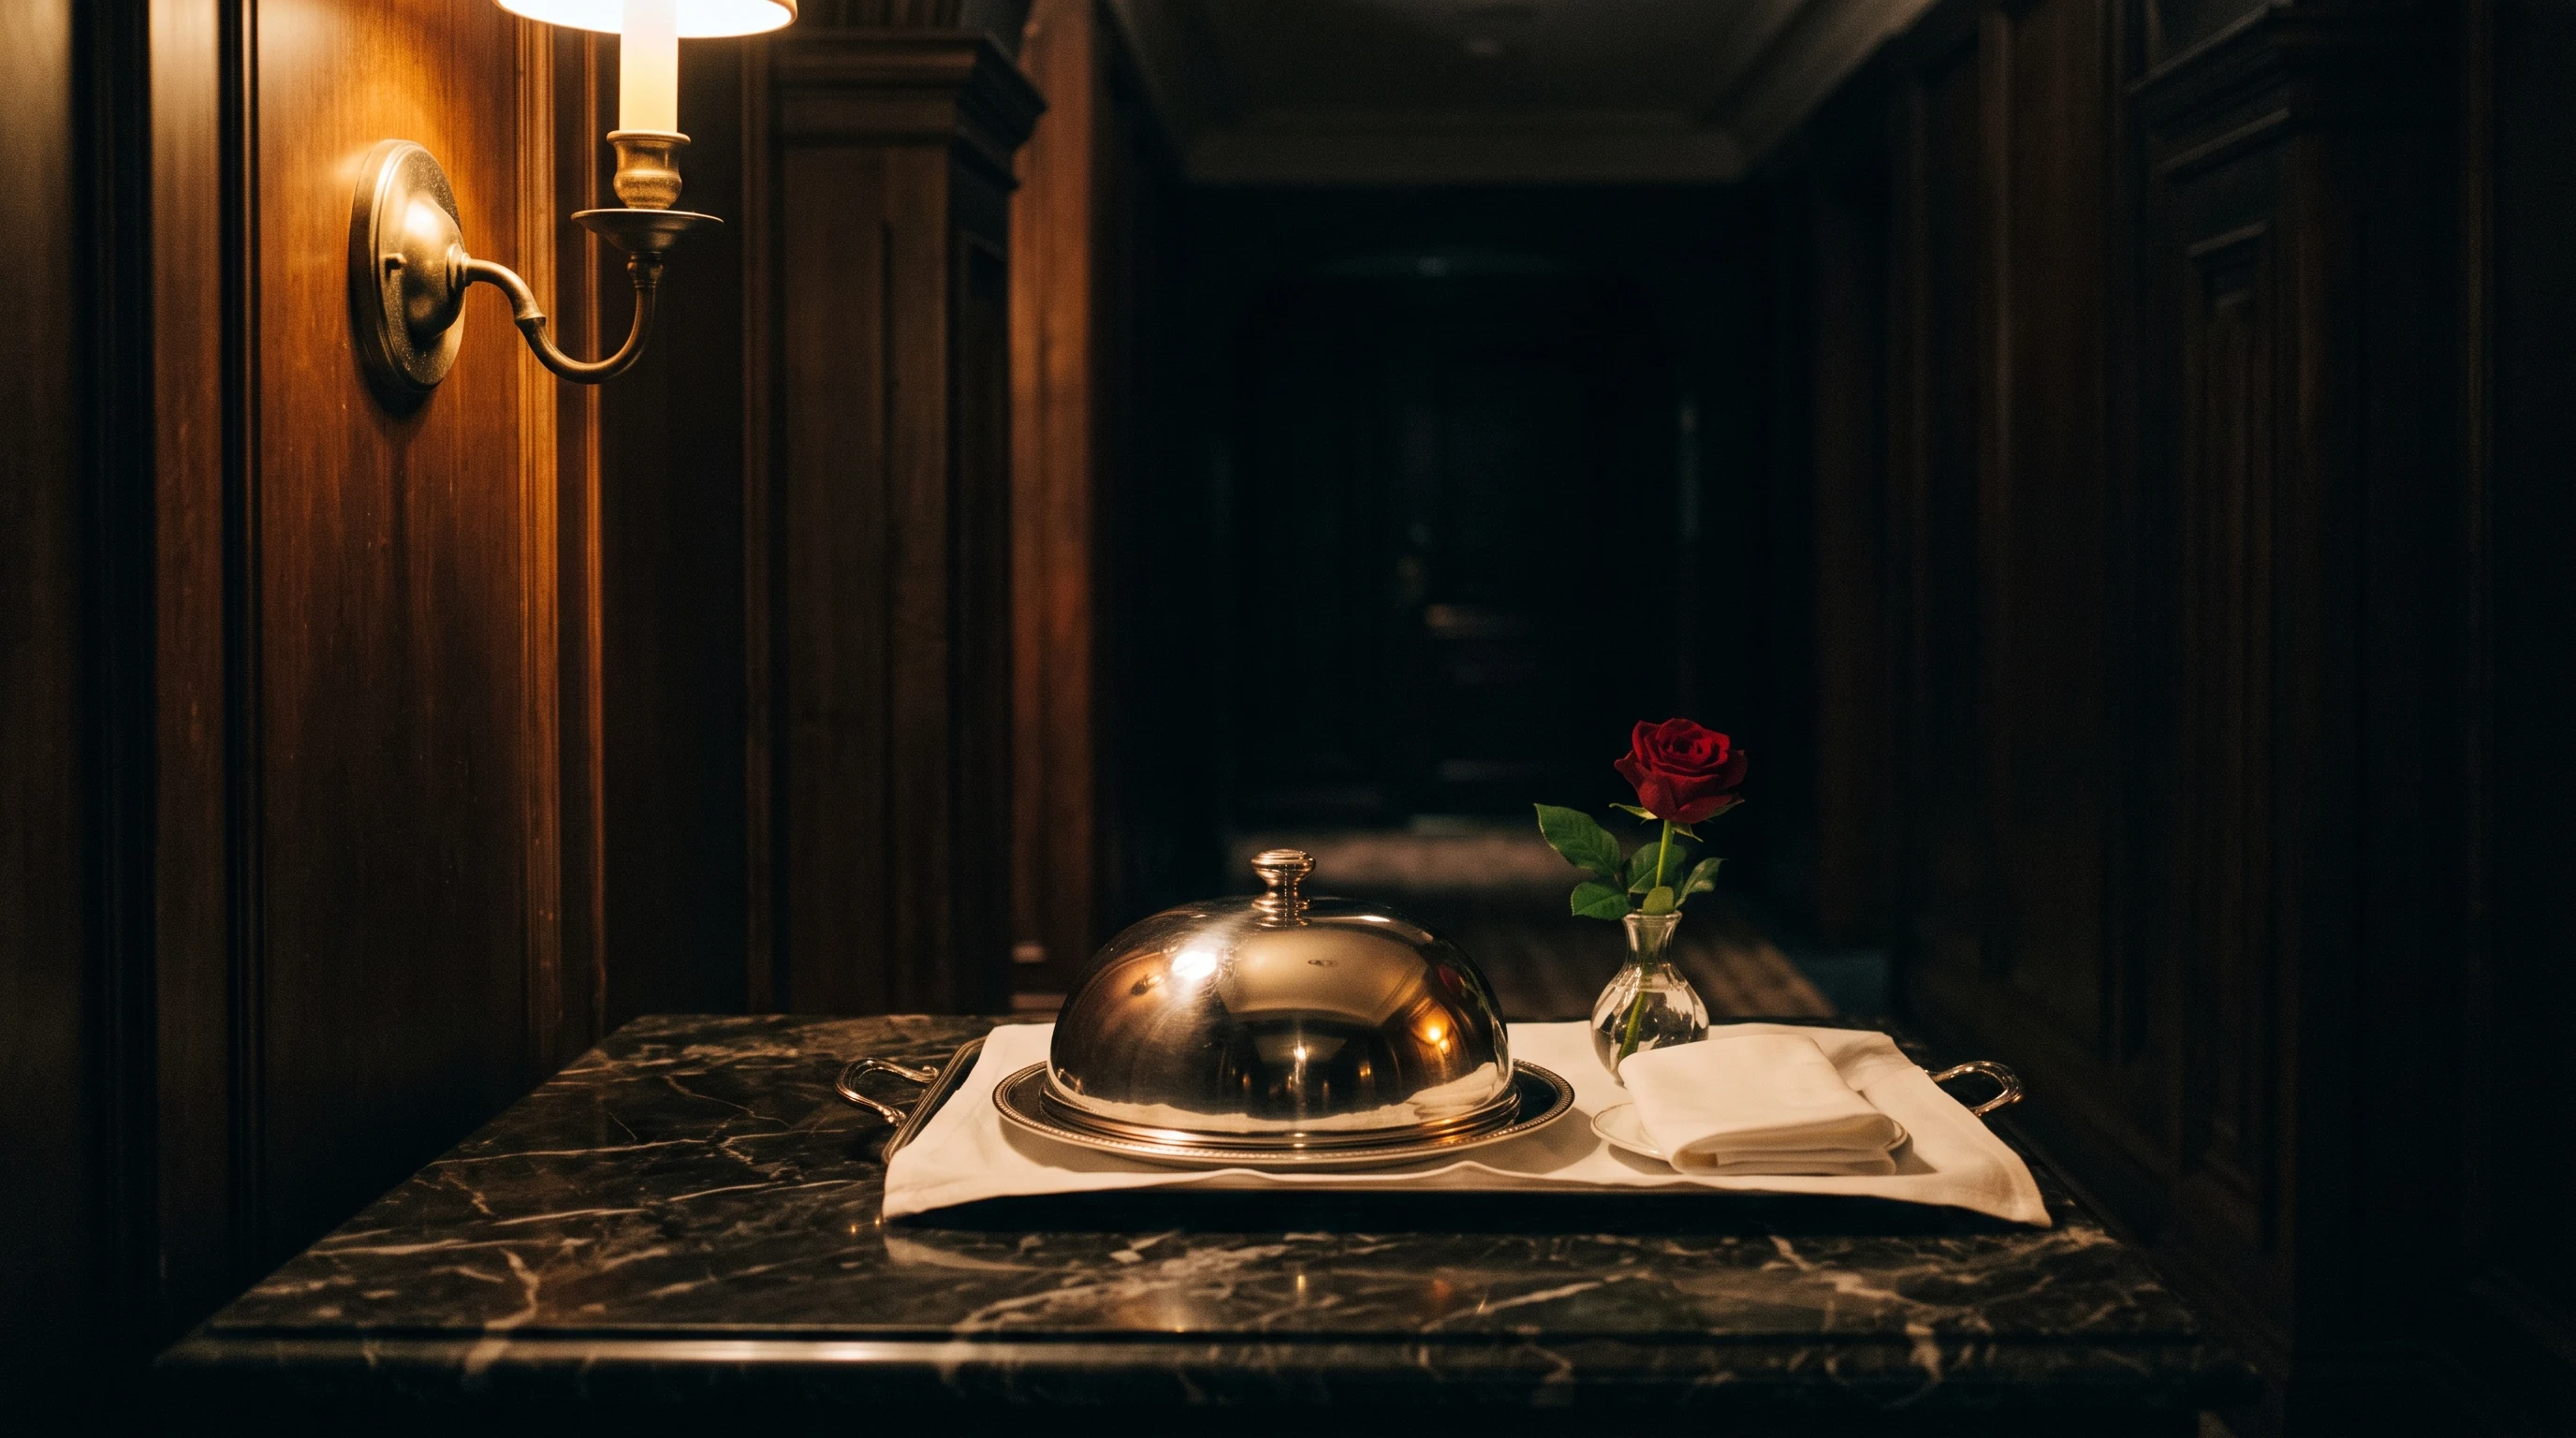
At 10:40 on a Wednesday night, a guest in a fourth-floor suite at a 180-room resort decides she is hungry.
There is a card on the nightstand. Heavy stock, printed, hotel typeface, a small line drawing of a cloche. Eleven items and a four-digit extension. She picks up the handset and dials. Four rings, then a hold tone, because the one person covering in-room dining at that hour is on nine, delivering somebody else’s club sandwich.
Two floors down, the hotel’s restaurant is still open. Nineteen covers on the floor. A POS terminal at the host stand, ticket times on a screen above the pass, a chef who can tell you exactly how many branzino are left. Every item on the card in her hand comes out of that kitchen.
She hangs up and orders from a delivery app instead.
The property just lost a cover to its own kitchen.
Widen out and the shape of this gets strange. A hotel runs in-room dining as a separate business. Its own printed card. Its own phone extension. Its own ordering path, its own menu, frequently its own payroll. And it sources every plate from a restaurant that is already a fully instrumented venue sitting on the property’s book, with tables, covers, timing, ticket rails, and a POS that knows the margin on everything.
The room is not a new venue. It is another cover at one the hotel already runs.
Call it the phantom venue: a venue the industry operates but does not measure, does not integrate, and cannot see.
The proof that it is a phantom is what happens when you go looking for it in the public numbers. We went looking and could not find it: not in CBRE’s published trends, not STR’s, not HotStats’, not PwC’s. Rooms get reported. F&B gets reported as a department. In-room dining disappears inside F&B and never comes back out. There is no published average check for room service. There is no capture-rate benchmark per occupied room. A GM who wants to know whether the rooms are under-ordering has nothing to compare against. A venue nobody measures is, definitionally, a phantom.
One company ran the experiment anyway, thirteen years ago, at nearly 2,000 rooms. It got the answer right and never named it.
Room service did not decline. It got decommissioned.
Forbes, citing the American Hotel and Lodging Association, put the collapse in two numbers: by 2016, only 22 percent of U.S. hotels offered room service, a drop from the 37 percent that offered it in 2014.
That number is a rate of change, not a slow fade across a decade of shifting guest taste. Fifteen points in two years. Consumer preference does not move like that. Capital allocation does. What that number records is a large number of operators independently reaching the same conclusion in the same eighteen months and acting on it.
They had reasons, and the reasons were on the record at the time. Scott Berman, then a partner at PricewaterhouseCoopers, told CBS News New York in 2013 that “the food and beverage side of the business is the most difficult, the most difficult to make money, most difficult to please customers.” He pointed at labor costs as what made it expensive for a hotel to run.
The strategic version of that same sentence showed up on an earnings call seven years later. Christopher Nassetta, CEO of Hilton, describing brand-level work to shareholders on the Q4 2020 call, said the point was “making them higher-margin businesses and creating more labor efficiencies, particularly in the areas of housekeeping, food and beverage and other areas,” and that when the industry came out of the crisis, “those businesses will be higher margin and require less labor than they did pre COVID.”
That is not a man describing a pandemic measure. That is a man describing a structural cost that had been visible for years, and a moment when the industry finally felt able to address it.
So the department went. And the industry told itself a tidy story about why: room service loses money.
That story is wrong.
Four out of five hotels made money on room service
Go to the most careful public analysis of actual room-service financials and the tidy story falls apart in one sentence.
David Sangree, MAI, CPA, president of Hotel & Leisure Advisors, working from real hotel financial statements, found that in 2012 room service revenue was down to 1.2% of total revenue, compared to 1.3% in 2011. Revenue averaged $866 per room per year against $1,157 five years earlier, a decrease of 25.1%. Note the unit, because it gets misquoted constantly: that is annual revenue per available room, not a check average.
Sangree is blunt about the cost side. For many hotels, he writes, “the amount of revenue generated can barely cover the cost to run the service,” and at urban hotels with high labor costs “the properties frequently lose money in the department.”
Then comes the sentence that ruins the slogan: “approximately 20% of our sample showed a loss while the majority of the properties reported a profit.”
The majority made money. The analysis dates to 2013, and we have not found a cleaner one published since, which is itself part of the problem. But take it at face value. Four out of five properties in a real financial sample were not bleeding on room service. They were booking a profit on it.
So the case against the phantom venue is not that it bleeds. Anyone arguing that has not read the numbers, and a GM who has actually run the department knows it.
The case is stranger, and harder to answer. It is that a line worth 1.2% of total revenue is being operated as a standalone business. Its own printed collateral. Its own extension. Its own menu engineering. Its own ordering path. Often its own labor. Nobody would build a second front desk to handle 1.2% of arrivals. Nobody would stand up a second reservations department for 1.2% of bookings. Hospitality did exactly that for food, and then, when the arithmetic finally got loud enough, shut the whole thing down rather than fold it into the venue two floors below.
One more thing about that 1.2%, said carefully. It is a capture number, not an appetite number. It records what the phantom venue managed to book through a printed card and a four-digit extension at properties where nobody was measuring the miss. It does not record what the rooms wanted. Nobody publishes what the rooms wanted, because measuring that would mean treating the room as a venue with a capture rate, which is precisely the thing the industry has never done.
Hilton removed the phantom venue in 2013 and kept the covers
The New York Hilton Midtown, nearly 2,000 rooms, eliminated room service effective August 2013 and cut 55 jobs, citing “a decline in traditional room-service requests over the past several years.” It was covered, correctly, as the biggest hotel in New York killing room service. It got read as an ending.
It was a re-routing.
Two months later the same property opened Herb n’ Kitchen, a market-style outlet on the ground floor, and it kept in-room delivery. Beth Scott, then Hilton’s vice president of global product development, was on the record about the reason behind the format: a declining demand for room service.
Hold those two facts next to each other. Hilton did not conclude that guests had stopped wanting food in their rooms. Hilton concluded that the room did not need a venue of its own in order to get it there. The delivery survived. The department did not.
That is this entire argument, executed at scale, by an operator large enough to absorb being wrong, in 2013. It never got a name, so it got filed under cost-cutting, and the industry took away the wrong lesson: that room service was over, rather than that the phantom venue was.
What Hilton had, and what most independents also have and rarely use, was a real F&B operation on the ground floor, already running covers, already instrumented, already staffed at the hours that matter. The gap was never the kitchen. The gap was the routing.
The cost base under the phantom venue is the fastest-inflating line in the hotel
If the case was arguable in 2013, the cost side has since settled it.
CoStar’s STR data, reported in December 2024, found that F&B labor costs grew nearly 15% in 2024, “outpacing all other departments,” with F&B rising to 32% of total hotel labor costs. Labor costs per available room were up 11% year to date across every department combined. F&B was the accelerant.
CBRE Hotels Research, in November 2025, described the structure of that department plainly: as a share of total F&B department expenses, labor is the largest at 59.4%. Six of every ten dollars the department spends is a person.
Here is the part operators should sit with, because it cuts against the fatalism. Demand is not the problem. In that same CBRE analysis, F&B revenue per occupied room rose 3.8% in the first half of 2025, “exceeding the 3.0% increase in total hotel revenue.” Guests are spending more on food and drink at hotels, and doing it faster than they are spending more on hotels. The revenue line is healthy. The cost line is the one running away.
Then the staffing picture, stated honestly. AHLA’s February 2025 survey with Hireology, 282 hoteliers polled between December 6, 2024 and January 3, 2025, found 65% reporting staffing shortages. That is an improvement, down from 76% in May 2024. The crisis is easing, and anyone telling you otherwise is selling something. But in the same survey, “more than seven in 10 of the hotels surveyed (71%) said they had job openings they were unable to fill despite active searches,” with culinary among the roles they could not fill, at 14%.
Put the four facts in a single line. A 1.2%-of-revenue business, sitting on the most labor-intensive department in the hotel, in the year that department’s labor grew faster than any other, at properties that cannot fill roles they have already posted.
The standalone version of in-room dining does not survive that arithmetic. Not because it loses money. Because it is a rounding error with a headcount, and the headcount is the most expensive and hardest to hire in the building.
The room is a table. Treat it like one.
Strip away the vocabulary and look at what room 412 actually is at 10:40 on a Wednesday.
A party of one. A seating time. An order. A check. A runner. A table number that happens to have four digits and a door.
The only thing separating it from table 14 downstairs is that at some point the hotel decided to give it a different front door, a printed card and a phone extension instead of a host stand, and never revisited the decision. The card on the nightstand is the artifact of that decision, still sitting there under the lamp: a paper menu attached to a phone number, which is to say a 1978 interface with a 2026 cost base underneath it.
Replace the card with a QR card and the room joins the restaurant’s book.
Here is what that looks like from the suite. She scans. The menu renders on her own screen, the real one, tonight’s, with the branzino already gone from it, 86’d an hour ago when the kitchen ran out. She taps the short rib and sees the plate. She asks whether it is worth coming down instead, and the terrace appears, lit, with the last two tables open at 11. She orders. The order reaches the same kitchen that feeds table 14, with 412 where the table number goes. The check goes to her room, itemized.
No new venue. No new extension. No new card to print and reprint every time the chef changes a garnish. The kitchen is the kitchen it always was.
Guests are already fluent in this. The National Restaurant Association’s 2024 technology research found diners saying they are fine placing an order “via a smartphone app (70% in limited-service, 63% in fullservice) or QR code (52% when dining in an LSR, 48% in table-service restaurant).” Be precise about what that measures: consumer comfort, not operator adoption. Roughly half of diners say they are comfortable ordering by QR code, two-thirds by app in full-service. Nobody has to be taught the gesture.
The behavior has already won elsewhere. Shake Shack’s kiosks became the chain’s largest ordering channel, and on the Q1 2024 earnings call CFO Katie Fogertey said kiosk checks run larger than checks in other in-store order channels “by a high teens percentage.” A burger counter is not a resort, and that figure does not transfer to a suite. The direction of it is what matters. Given a screen, people build a bigger order than they do talking to a person.
There is now real academic work on why. Researchers at the University of South Florida, led by Dipayan Biswas, published eight studies in the Journal of the Academy of Marketing Science, six of them field studies at restaurants, analyzing more than 23,000 real orders. The finding: “While digital ordering can enhance convenience and efficiency, many consumers will opt for unhealthier food choices and spend more.” The mechanism they identify is that “digital ordering modes foster a more automatic decision-making process with lower cognitive involvement.” You browse instead of asking. You add the second thing, because adding it costs nothing socially.
Two honest notes. The researchers quantify the indulgence effect, 61% of digital orders were unhealthy, more than three percentage points above non-digital. They publish no figure at all for the spending effect. “Spend more” is the finding. The size of it is not public, and this category already has enough invented numbers.
The second note is not a caveat at all. The effect is strongest at dinner, when people are tired and lean harder on the screen. Dinner is exactly the daypart the room owns.
We can find no published average room-service check, so any figure here is invented and should be read that way. Say $60 a ticket at the 180-room resort. Six tickets on a Wednesday night is $360. Twenty tickets is $1,200. The gap between those two nights is not a kitchen problem, a menu problem, or a demand problem. It is the difference between a card that leads to a hold tone and a menu that appears in the guest’s hand. That gap has never shown up in anyone’s reporting, because the venue it belongs to does not exist on paper.
What changes on the P&L is mostly subtraction. The separate extension goes away. The separately printed collateral goes away. The order-taking function stops being a post somebody has to cover through the back half of the night and becomes a screen the guest is already holding. The runner still runs. The cook still cooks. The covers move from a department nobody could measure into a venue that has been measured, by the minute, for years.
Hilton called its version Herb n’ Kitchen. Most properties do not need to build an outlet to get there. They need to stop running two ordering systems for one kitchen.
FlowStay treats the room as a cover on a venue you already run. The QR card on the nightstand is the guest’s whole onboarding. The menu renders on the guest’s screen, live, with the agent describing each dish as it appears, and the terrace and the chef’s table appearing on cue if she would rather come down. The order posts to the room against the kitchen already open, itemized, with no booking fee. Live in 24 hours on supported systems.
The phantom venue was never a venue. It was a routing decision made before anyone had a screen in their pocket, and never opened again. The suite upstairs is just another table. Seat it.
We are taking pilot properties now, 30 days at no cost. If you have a printed card on a nightstand and a kitchen still running at 10:40, that is the entire prerequisite. eric@flowstay.ai.
At 11:02 there is a knock at 412. The tray comes in with the short rib under a cloche, the one she saw from the bed and wanted, still steaming when the lid comes up. She eats by the window with the terrace lights below and the water black beyond them. Downstairs the kitchen plates the last covers of the night, one of them four floors up, and the woman in the suite never finds out she was anything more complicated than a table.